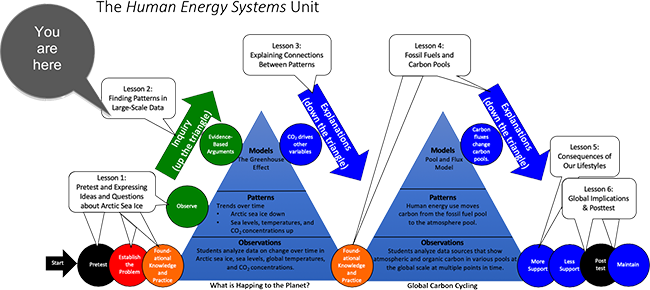
Human Energy Systems | Lesson 2 - Describing Patterns in Large-Scale Data

Overview

Using a jigsaw activity, students discuss generalizability, representation, and short-term variability using four different large-scale data sets related to climate change: global temperature, sea level rise, long-term atmospheric CO2 concentration, and short-term atmospheric CO2 annual cycle.

Guiding Question

What is happening to global temperature, atmospheric carbon dioxide, and sea level?

Activities in this Lesson

  • Activity 2.1: Home Groups: Four Considerations for Large-Scale Data (45 min)
  • Activity 2.2: Expert Groups: Analysis of Large-Scale Data (45 min)
  • Activity 2.3: Home Groups: Share Expertise (60 minutes)
  • Activity 2.4: Evidence-Based Arguments for Patterns in Earth Systems (30 min)

Unit Map

Human Energy Systems Lesson 2 Map

Target Student Performance

Activity

Target Performance

Lesson 2 – Finding Patterns in Large Scale Data (students as investigators)

Activity 2.1: Home Groups: Four Considerations for Large Scale Data (45 min)

Students in home groups express initial ideas about patterns and changes over time for four variables in Earth systems: global temperatures, global sea levels, Arctic sea ice, and atmospheric CO2 concentrations.

Activity 2.2: Expert Groups: Analysis of Large-Scale Data (45 min)

Students in expert groups investigate multiple representations of the four variables in and the Earth systems that they measure, generating explanations and questions.

Activity 2.3: Home Groups: Share Expertise (60 min)

Students return to home groups and share their expertise about patterns of change for four variables in Earth systems: global temperatures, global sea levels, Arctic sea ice, and atmospheric CO2 concentrations.

Activity 2.4: Evidence-Based Argument for Earth Systems (30 min)

Students compare patterns of change for the four Earth systems variables and record questions about what causes the patterns and how the patterns are related to one another.

NGSS Performance Expectations

High School

  • Earth’s Systems. HS-ESS2-2. Analyze geoscience data to make the claim that one change to Earth’s surface can create feedbacks that cause changes to other Earth systems.
  • Earth’s Systems. HS-ESS2-2. Analyze geoscience data to make the claim that one change to Earth’s surface can create feedbacks that cause changes to other Earth systems.
  • Weather and Climate. HS-ESS2-4. Use a model to describe how variations in the flow of energy into and out of Earth’s systems result in changes in climate.
  • Earth’s Systems. HS-ESS2-6. Develop a quantitative model to describe the cycling of carbon among the hydrosphere, atmosphere, geosphere, and biosphere.
  • Earth and Human Activity. HS-ESS3-5. Analyze geoscience data and the results from global climate models to make an evidence-based forecast of the current rate of global or regional climate change and associated future impacts to Earth systems.
  • Earth and Human Activity. HS-ESS3-6. Use a computational representation to illustrate the relationships among Earth systems and how those relationships are being modified due to human activity.

Middle School

  • Earth and Human Activity. MS-ESS3-5. Ask questions to clarify evidence of the factors that have caused the rise in global temperatures over the past century.

Three-dimensional Learning Progression

Understanding data representations. Lessons 1 and 2 focus on helping students make sense of representations of data about Earth systems. This is difficult and challenging for many students. We see four interconnected issues:

  1. Representation: Students see many different representations of data about Earth systems. For example, in Activities 2.2 and 2.3 students see (a) animations of satellite data showing maps that change over time, (b) tables with numerical representations of sea ice extent, and (c) graphs showing patterns and trends. Students need to recognize that even though they look different, these are all representations of the same phenomena. They also need to recognize that the same variables (e.g., time, location, temperature, CO2 concentration) are represented in different ways, and that there are different choices about which data to represent from a larger data set.
  2. Generalizability: Data about Earth systems are usually selected to be representative of patterns in systems, but the relationship between the patterns in the representation and the patterns in the Earth systems can be difficult and confusing. For example, the graphs of CO2 concentrations show measurements taken in a single location—Moana Loa in Hawaii. How are patterns in these data connected to data from other places, such as Michigan or Antarctica? Other representations make other choices about time scale and geographic location, or show averages rather than data points from a single time and place.
  3. Short-term variability: The data sets that student look at show two different patterns in short-term variability:
    1. Like Arctic sea ice data, the temperature and sea level dat show random variation from one year to the next; there is no good way to predict whether these variables will go up or down in the next year, or how much. Most humans are very good at finding patterns, even when they don’t really exist (this is why games of chance are so popular). So students need to recognize randomness and understand how it limits our ability to make claims about short-term patterns or predictions of how these data will change in the next year.
    2. In contrast, the Moana Loa CO2 data show a regular seasonal pattern. Students need to be able to recognize and analyze this pattern, and to expect that there should be an explanation for this pattern. (They will study the explanation for this seasonal cycle in Lesson 4.)
  4. Long-term trends: The other Earth systems are like Arctic sea ice in that they show clear trends over longer periods of time (though in the opposite direction—as Arctic sea ice goes down, temperature, sea level, and CO2 concentrations are all going up). Students need to use strategies they studied in Lesson 1 to identify these long term trends.

Explaining patterns in Earth systems data. Students need to recognize that random patterns in short-term variability are very difficult or impossible to explain, but that good explanations for long-term trends are often possible.

Some students will probably suggest that these variables are related, and that they are connected with “climate change” or “global warming.” They need to recognize that this kind of explanation—recognizing relationships between variables—is useful, but doesn’t go very far. Scientists look to understand mechanisms: Which variables are causing the trends, and which are effects? How do those cause-effect relationships work? We hope that Lesson 2 will end with these unanswered questions, to be addressed in later lessons.

Key Ideas and Practices for Each Activity

In Activity 2.1, students are introduced to the first of five different large-scale data sets dealing with different phenomena in the Earth’s system. The first data set deals with arctic sea ice extent. When scientists interpret any data set, there are certain pieces of information that are crucial for helping them make sense of the data. We focus on four of those in this activity: representation, generalizability, short-term variability, and long-term trends.

  • The first is generalizability. One reason climate change is so difficult for the public to understand is that scientists use a combination of many global and local data sets to find patterns that are not always clear locally or on short time scales. Using other sources, they determine when and how local signals may or may not be reflective of a global trend.
  • The second is representation. Scientists also need to examine what time period and data are being represented in the table, so they know if it is generalizable to other times and places or not.
  • Third, scientists also need to distinguish between short-term variability and long-term trends. Short-term variability is predictable in some data sets (like atmospheric CO2 concentrations rising each winter and falling each summer), and unpredictable and stochastic in other data sets (like arctic sea ice extent, which is subject to many factors in the earth’s climate system).
  • Finally, scientists also use long-term trends in data to understand what has happened in the past and to predict what might happen in the future. In this activity students are introduced to these four considerations. Students fill in the first row in the 2.1 Finding Patterns Tool together as a class.

In Activity 2.2, students begin a jigsaw activity to examine the other four large-scale data sets: sea level, global temperatures, historic atmospheric CO2 concentrations, and annual patterns in atmospheric CO2
concentration. The ideas introduced in this Jigsaw are extended through the rest of the Lesson. For more information about the Jigsaw discussion strategy, see https://www.jigsaw.org/. To begin, students form home groups and discuss the goals for the Lesson. Then, students form expert groups to examine a large-scale data set that represents a global phenomenon. They read about their expert group topic and work with their groups to discuss the “four considerations” covered in Activity 2.1 for their own phenomenon. They fill in their expert group’s corresponding row on the 2.1 Finding Patterns Tool. At this point in the Unit, the students may have a difficult time understanding why these considerations are valuable, and this activity aims to help establish why these considerations are important.

In Activity 2.3, students return to their home groups to share their expertise about their phenomena, using the four considerations as a frame for their presentation, and fill in the remaining rows in their Finding Patterns Tool. This provides yet another context for helping students work through the challenges of interpreting large-scale data sets. Why, for example, is a measurement of carbon dioxide concentrations in the atmosphere representative of a global pattern? How do scientists know that? Some of these questions will remain unanswered at the end of this activity, which is intentional. Students will revisit these questions later in the unit.

Finally, in Activity 2.4 students use the Finding Patterns Tool for Earth Systems to identify patterns across data sets and discuss what may be causing these patterns. At this point in the unit, students will have collected evidence of various global trends related to climate change. However, they may not have evidence that explains that the driving factor of all of these trends is the increase in carbon dioxide in the atmosphere due to human activity (primarily the combustion of fossil fuels). The unanswered questions in this tool set students up for learning that takes place in the following lessons, when the students delve deeper into the Keeling Curve and learn about the driving forces for all phenomena they studied in this lesson.

Content Boundaries and Extensions