Human Energy Systems | Lesson 1 - Pretest and Expressing Ideas

Overview

Students take the unit pretest, practice how and why scientists construct graphs to represent data and construct a graph of arctic sea ice extent from 1979-2015 and identify a trend in the data: arctic sea ice is declining.

Guiding Question

What is happening to arctic sea ice?

Activities in this Lesson

  • Activity 1.1: Human Energy Systems Unit Pretest (20 min)
  • Activity 1.2: Expressing Ideas and Questions about Arctic Sea Ice (40 min)
  • Activity 1.3: Graphing Arctic Sea Ice (45 min)
  • Activity 1.4: Drawing a Trend Line (40 min)
  • Activity 1.5: Finding a Trend in Arctic Sea Ice (40 min)
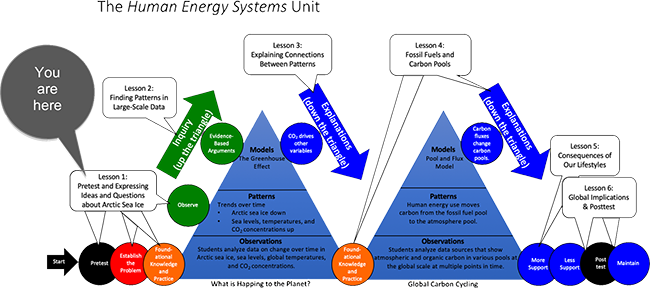
Unit Map

HES Lesson 1 Map

Target Student Performance

Activity

Target Performance

Lesson 1 – Pretest and Expressing Ideas about Arctic Sea Ice (students as questioners and investigators)

Activity 1.1 Human Energy Systems Unit Pretest (20 min)

Students show their initial proficiencies for the overall unit goals:

1.     Questioning, investigating, and explaining how the Earth’s climate is changing

2.     Explaining and predicting how carbon cycles and energy flows in Earth systems.

Activity 1.2: Expressing Ideas and Questions about Arctic Sea Ice (40 min)

Students express ideas and record questions about why Arctic sea ice seems to be shrinking.

Activity 1.3: Graphing Arctic Sea Ice (45 min)

Students use data on Arctic sea ice to construct graphs showing patterns in changing coverage over time.

Activity 1.4: Drawing a Trend Line (40 min)

Students use multi-year averages to construct a trend line using data on Lake Superior ice cover.

Activity 1.5: Finding a Trend in Arctic Sea Ice Data (40 min)

Students use multi-year averages to construct a trend line using data on Arctic sea ice.

NGSS Performance Expectations

This lesson does not feature a mastery of any of the NGSS performance expectations but provides students with foundational practices and knowledge needed to master all of the performance expectations in the rest of the unit.

Three-dimensional Learning Progression

Understanding data representations. Lessons 1 and 2 focus on helping students make sense of representations of data about Earth systems. This is difficult and challenging for many students. We see four interconnected issues:

  1. Representation: Students see many different representations of data about Earth systems. For example, in Lesson 1 students see (a) animations of satellite data showing maps that change over time, (b) tables with numerical representations of sea ice extent, and (c) graphs showing patterns and trends. Students need to recognize that even though they look different, these are all representations of the same phenomena. They also need to recognize that the same variables (e.g., time, extent of sea ice) are represented in different ways, and that there are different choices about which data to represent from a larger data set.
  2. Generalizability: Data about Earth systems are usually selected to be representative of patterns in systems, but the relationship between the patterns in the representation and the patterns in the Earth systems can be difficult and confusing. For example, students make graphs after choosing one month (September) and recording data for September of each year. What patterns in these data extend to other months? How are patterns in these data connected to data from other places, such as the Antarctic or lakes that freeze over in North America? Students need to consider and answer questions such as these.
  3. Short-term variability: Like many data sets about Earth systems, Arctic sea ice data show random variation from one year to the next; there is no good way to predict whether the extent of ice will go up or down in the next year, or how much. Most humans are very good at finding patterns, even when they don’t really exist (this is why games of chance are so popular). So students need to recognize randomness and understand how it limits our ability to make claims about short-term patterns or predictions of how sea ice will change in the next year.
  4. Long-term trends: Arctic sea ice is also like other Earth systems in that even when data are noisy in the short term, there can also be clear trends over longer periods of time. Students need to develop strategies for identifying and representing long term trends, such as the averaging strategy that they practice in Activity 1.5.

Explaining patterns in Earth systems data. Students need to recognize that random patterns in short-term variability are very difficult or impossible to explain, but that good explanations for long-term trends are often possible.

Some students will probably suggest that the decreasing trend in Arctic sea ice is due to “climate change” or “global warming.” They need to recognize that this kind of explanation—recognizing relationships between variables—is useful, but doesn’t go very far. Scientists look to understand mechanisms: How is climate change affecting Arctic sea ice, and what is causing climate change. We hope that Lesson 1 will end with these unanswered questions, to be addressed in later lessons.