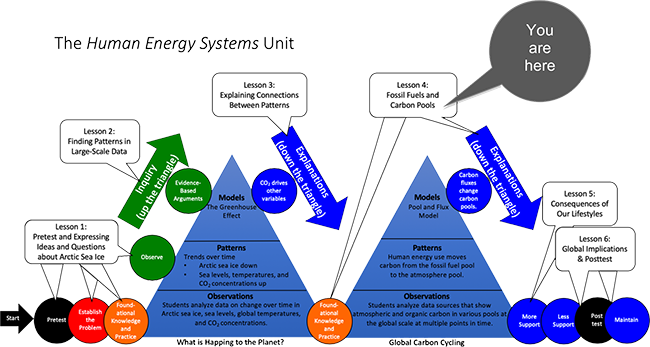
Human Energy Systems | Lesson 4 - Fossil Fuels and Carbon Pools

Overview

Students are introduced the Four Questions at a large scale to examine the major pools of carbon (with special attention to the fossil fuel pool). Then they look more closely at the Keeling Curve and examine how fossil fuels are formed and how we use them.

Guiding Question

What causes and how can we predict changes in CO2 concentrations?

Activities in this Lesson

  • Activity 4.1: Questions for this Lesson (30 min)
  • Activity 4.2: Carbon Pools and Fossil Fuels (35 min)
  • Activity 4.3: Tiny World Modeling (50 min)
  • Activity 4.4: Global Computer Model (50 min)
  • Optional Activity 4.5: Effects of Seasons and Oceans (50 min)

Unit Map

Ecosystems Unit Map

Target Student Performance

Activity

Target Performance


Lesson 4 – Fossil Fuels and Carbon Pools (students as questioners, investigators, and explainers)

Activity 4.1: Questions for this Lesson (30 min)

Students apply the large-scale Four Questions to two patterns in the Keeling curve (showing atmospheric CO2 concentrations): the annual cycle and the long-term trend.

Activity 4.2: Carbon Pools and Fossil Fuels (35 min)

Students identify carbon pools in Earth systems and investigate the fluxes associated with human use of one pool: fossil fuels.

Activity 4.3: Tiny World Modeling (50 min)

Students investigate the relationship between pools and fluxes in a physical model of a tiny world, showing how changing photosynthesis, cellular respiration, and combustion fluxes can account for both an annual cycle and a long-term trend in the atmospheric CO2 pool.

Activity 4.4: Global Computer Model (50 min)

Students use an online computer model to make quantitative predictions of how changes in photosynthesis, cellular respiration, and combustion fluxes will affect the long-term trend in the atmospheric CO2 pool.

Optional Activity 4.5: Effects of Seasons and Oceans (50 min)

Students use a diagrammatic carbon cycle model to investigate how oceans and seasons in the Northern and Southern Hemispheres affect the annual cycle and a long-term trend in the atmospheric CO2 pool

NGSS Performance Expectations

High School

  • Ecosystems: Interactions, Energy, and Dynamics. HS-LS2-5. Develop a model to illustrate the role of photosynthesis and cellular respiration in the cycling of carbon among the biosphere, atmosphere, hydrosphere, and geosphere.
  • Earth’s Systems. HS-ESS2-2. Analyze geoscience data to make the claim that one change to Earth’s surface can create feedbacks that cause changes to other Earth systems.
  • Weather and Climate. HS-ESS2-4. Use a model to describe how variations in the flow of energy into and out of Earth’s systems result in changes in climate.
  • Earth and Human Activity. HS-ESS3-5. Analyze geoscience data and the results from global climate models to make an evidence-based forecast of the current rate of global or regional climate change and associated future impacts to Earth systems.
  • Earth and Human Activity. HS-ESS3-6. Use a computational representation to illustrate the relationships among Earth systems and how those relationships are being modified due to human activity.

Middle School

  • Waves and Electronic Radiation. MS-PS4-2. Develop and use a model to describe that waves are reflected, absorbed, or transmitted through various materials.
  • MS-ESS2-1. Develop a model to describe the cycling of the Earth’s materials and the flow of energy that drives this process.
  • Human Impacts. MS-ESS3-4. Construct an argument supported by evidence for how increases in human population and per-capital consumption of natural resources impact Earth's systems.
  • Earth and Human Activity. MS-ESS3-5. Ask questions to clarify evidence of the factors that have caused the rise in global temperatures over the past century.

Three-dimensional Learning Progression

Understanding how the Keeling Curve represents patterns in the Earth’s atmosphere. The Keeling Curve is often presented as easily interpretable evidence that the concentration of CO2 in the Earth’s atmosphere is increasing, but our research shows that interpreting this graph presents many challenges for students. In particular:

  • The variable measured—concentration of CO2 in parts per million—is not easy for students to understand.
  • It is not at all clear to students how measurements of CO2 concentration on a mountain in Hawaii might be related to CO2 concentrations in other parts of the world. The Pumphandle Video, introduced to students in Lesson 2, shows the complex relationships among measures of CO2 concentration taken at different locations on Earth. (See below for a description of the Pumphandle Video.)

Explaining patterns of change in CO2 concentrations. We assume that students studying this Unit will be familiar with carbon-transforming processes (photosynthesis, cellular respiration, combustion, digestion, biosynthesis) in individual plants and possibly animals and decomposers. In this Lesson they consider how these processes affect carbon pools on a global scale.

There are two patterns evident in the Keeling Curve: an annual cycle caused primarily by changing rates of photosynthesis in the Northern Hemisphere and a long-term increase caused primarily by burning of fossil fuels and land-use changes that release carbon from biomass or soil carbon into the atmosphere. This lesson focuses on helping students use pool-and-flux models to explain those patterns. There are many fluxes that move carbon into or out of the atmosphere, but most of those are balanced by other fluxes. The flux from fossil fuel combustion, in particular, is not balanced: it moves carbon permanently from the fossil fuel pool into the atmosphere.

However, most students rely on simpler heuristics or rules of thumb rather than pool-and-flux models to explain patterns of change, including the good vs.bad heuristic and the correlation heuristic.

  • Good vs. bad heuristic They use an informal frame that describes things that happen to the environment as good (e.g., less pollution) or bad (e.g., using fossil fuels). For instance, here is a reason that one student gave for cutting fossil fuel use: “If it cuts down and maintain a low level use, the air will clear up and it will be good for animals and humans to breath clean air.” Students using this heuristic also connect bad actions to bad outcomes: “[b]ecause I think we’ve reached a point where we’ve done too much damage to earth, personally. And I don’t think we can come back from that.”
  • Correlation heuristic: These students often applied the correlation heuristic, conflating changes in flux (slope of the graphed line) with changes in pool size (value on the Y-axis). The following written response reflects this type of thinking: “fossil fuels help to produce CO2 so if we cut it in half it would decrease.” Note how this student used “it” twice in the same sentence, perhaps without recognizing that each “it” had a different meaning:
    • if we cut it (CO2 emissions—the flux arrow) in half,
    • …it (CO2 concentration—a measure of the size of the atmospheric CO2 pool) would decrease.

Predicting patterns of change in CO2 concentrations. The good vs. bad heuristic and the correlation heuristic can be useful for many purposes, helping us to identify environmentally responsible actions and processes that cause climate change. However, these approaches often lead to spurious quantitative reasoning, such as when students conflate a change in flux with a change in pool size: Cutting CO2 emissions in half does NOT decrease CO2 concentration in the atmosphere; it merely makes the concentration go more slowly.

So in order to make accurate predictions, students must use quantitative reasoning to balance all the CO2 fluxes into and out of the atmosphere. Activities 4.3, 4.4, and 4.5 engage them in using the balance of fluxes to make predictions about changes in pool sizes in increasingly sophisticated ways.